Table of Contents
- Introduction
- The Gringo’s Thesis
- Equity Ownership vs. Credit
- Type of FII Investment
- Dividend Consistency & Growth
- Comparable Analysis
- Price-to-Book-Value
- Vacancy, Tenancy Risk & Location
- Sector Exposure
- Asset Participation
- Fund Size, Liquidity & Manager
- Other Pitfalls
- Additional Qualitative Research
- Historical Performance vs. CDI
- Future Outlook & Risks
- Tools & Research I Use
- Next Steps
- FII Deep Dives
- Disclosure
- Important Legal Disclaimer
Introduction
FIIs (Fundos de Investimento Imobiliário) are one of the most popular passive income investments in Brazil.
For Brazilian residents, they offer tax-free income, diversification, and a hedge against inflation. But not all FIIs are created equal. Many are lower quality or driven more by investor sentiment than sound fundamentals.
As a Canadian investor living in Brazil, I’ve developed a structured framework for analyzing FIIs based on data, risk, governance, and adjusted returns. This article shares that approach. No hype, no shortcuts.
Understanding how FIIs actually work is critical, because many structural incentives in the market can mislead investors. FII managers earn fees based on assets under management, creating pressure to grow aggressively, sometimes through dilutive new issuances. And since FIIs are still a relatively young asset class, many have underperformed Brazil’s basic interest rate (CDI) during recent periods of rising interest rates.
I find the idea of earning real, tax-free returns of 7–10% genuinely compelling. But those returns need context. Brazilian fixed income (like NTN-B) can offer similar yields with lower risk, while stocks may offer higher upside through equity risk premium.
It’s also important to understand the tax tradeoffs: FIIs aren’t necessarily more tax-advantaged than Brazilian stocks. That’s because:
- Dividends from Brazilian equities (but not interest on equity) are tax-free for residents
- Residents can sell up to R$20K/month of equities without triggering capital gains tax
- FIIs are taxed at 20% on capital gains with no exemption, although most income comes from tax-free monthly distributions
Still, there are strong arguments for including FIIs in a diversified portfolio. A 2013 Fidelity study found that adding 20–33% REIT exposure to a traditional 60/40 stock-bond mix boosted returns and improved the Sharpe Ratio (a measure of risk-adjusted performance). Similar results have been observed in Brazilian portfolios as well.
The Gringo’s Thesis
FIIs deserve a place in a well-diversified portfolio, especially for younger investors seeking long-term, income producing assets. These funds share some traits with fixed income, but offer two key advantages:
- High real yields locked in today should remain attractive, especially if real interest rates fall in the future
- Rental income from FIIs should keep pace with real world inflation over a long time horizon, even if official inflation (IPCA) is understated
In the rest of this post, I’ll break down the exact criteria I use to evaluate FIIs, from dividend sustainability to concentration risk.
I will also provide you with the tools and research that I use when doing my own analysis.
Let’s dive in.
Equity Ownership vs. Credit
Since I invest in FIIs primarily for fixed income with an inflation hedge, I narrow my focus to brick-and-mortar (tijolo) FIIs — funds that own physical real estate and collect rent from those assets. I avoid high-yield credit (paper) FIIs that generate income from interest-bearing receivables, often tied to private credit.
Take KNCR11 (Kinea Income Fund) as an example. It’s a popular credit FII with nearly R$8 billion under management. Over the past 12 months, it distributed R$12.16 per unit, with a current market price around R$102.64, implying a return of 11.8%. KNCR11 aims to track the CDI (Brazil’s benchmark interest rate), but without being subject to a 15% tax rate. The average term of their receivables is 4.2 years, generally indexed to CDI.
This is likely a well-run fund from a reputable manager and worth further consideration if you are a credit investor. However, I don’t generally invest in credit FIIs because:
- Most credit FIIs have shorter duration exposure and tend to track CDI (I want to lock-in long-term real returns and I’m willing to take interest-rate risk)
- In my opinion credit quality is harder to analyze than for certain other tax advantaged investment options (funds like IFRA11 and JURO11 list debentures that can generally be marked-to-market and are rated by credit agencies)
- These funds could hold receivables related to office buildings (and I generally avoid exposure to office real estate)
All else being equal, credit FIIs should trade with higher yields than brick-and-mortar FIIs to offset their weaker long-term purchasing power. To maintain purchasing power, you typically need to reinvest a portion of your dividend distributions.
Type of FII Investment
I don’t invest in Fund-of-Funds because I consider them a poor value proposition. They typically layer two levels of management fees on top of the underlying assets, without delivering meaningful benefits. I’m fine with funds that hold other FIIs temporarily for income while waiting to deploy capital, but they should have a clear real asset focus.
The main Brazilian REIT index is the IFIX. It’s a sensible option for investors who don’t want to hand-pick individual FIIs. It offers built-in diversification and tends to deliver returns similar to a curated portfolio with less effort.
However, the IFIX comes with a few important drawbacks:
- Tax inefficiency for residents: Most of the income from FIIs comes from monthly tax-free distributions, but IFIX reinvests those, which leads to capital gains tax when units are sold. Unlike stocks, there’s no R$20K/month exemption on ETF redemptions
- Unwanted exposure: The IFIX includes assets I don’t want to hold, like credit FIIs or office space (which I cover later)
- Too many holdings: With 117 FIIs in the index, it likely includes many I’d avoid. For example, HCTR11, which I mention later
Because FIIs have become so popular among Brazilian income investors, I believe many investors may be over-allocated. Personally, I’ve allocated around one-sixth (≈16%) of my portfolio to FIIs, and even that may be too much.
Still, at this size, I’m able to achieve:
- Regional diversification across dozens of properties
- No more than ~3% exposure to any one fund or manager
For example, XP Malls (XPML11), a diversified mall operator with stakes in 29 shopping centers, is analyzed in depth in my dedicated XPML11 Deep Dive.
Honorable mention: You can also gain real estate exposure through stocks like ALOS3, though equities aren’t legally required to distribute 95% of their income like FIIs are.
Dividend Consistency & Growth
I start my FII analysis by reviewing dividend history on Funds Explorer. It’s one of the best tools for quickly checking how a fund distributes income, before diving into official reports. It also provides a quick overview of other metrics such as fund size and price-to-book value.
Brick FIIs
Take XPML11, for example. Here’s its dividend chart (screenshot from Funds Explorer):
XPML11 has paid consistently over time, with only a few disruptions (e.g. during the pandemic period). I ignore short-term fluctuations and focus on the long-term pattern of stability and real returns.

To double-check XPML11’s resilience, I reviewed:
- Payout history from February 2018 to May 2025
- Dividend growth, rising from R$0.60 in 2022 to R$0.92 today
- A 70% increase in payouts from 2019 to 2024 — about 11% CAGR
- The overall trendline for consistency and seasonality
- Its price-to-book ratio, which appears fair
- The fund’s strong liquidity profile
This kind of steady performance is exactly what I look for.
You can find a full breakdown of XPML11’s key metrics in the Overview page.
Important: I don’t just want recent growth. I want to see that the fund paid well in bad times too (COVID excepted), and that its dividends roughly track IPCA or IGP-M over time. If dividend growth lags real inflation, your purchasing power erodes.
I focus on:
- Consistency
- Alignment with real return targets that beat inflation
- Avoiding funds that eat into payouts through dilution or asset sales
XPML11’s performance suggests strong lease structures, indexation to inflation, and a stable tenant base. These are signs of a high-quality, income-oriented FII.
Paper/Credit FIIs
Now let’s contrast XPML11 with a typical paper FII, like KNCR11:

KNCR11 aims to track the CDI and reduce price volatility. But its dividend trend lacks real growth, since the fund doesn’t benefit from rental price increases. The yield floats with short-term interest rates, and a portion of the dividends typically needs to be reinvested to maintain purchasing power. If interest rates fall, investment returns could decline significantly.
Caution: Higher Yields = Higher Risk
It’s tempting to chase funds with temporarily high yields, but beware:
- Some funds achieve this via capital return, not income
- Others have unsustainable payout ratios, growing vacancies, or are inflating NAVs
- Look beyond the current number. Always check historical dividend patterns, indexation, and disclosure quality
Example: HCTR11. The dividend yield is currently over 19% and has been even higher in the past, but the price is down 79% since inception.
Comparable Analysis
When analyzing FIIs, I compare those in similar segments, like brick shopping centers, using a few key metrics to understand valuation and filter for quality, risk, and sustainability.
Key Metrics Used
Here are the key metrics I use and why:
| Metric | Why it Matters |
|---|---|
| Gross Dividend Yield | Quick snapshot of income potential, but can be distorted by one-time events or irregular distributions. |
| Adjusted Dividend Yield | Filters out non-recurring payouts to reflect a more sustainable, long-term income stream. |
| Operational KPIs | Metrics like Same Store Sales show potential for rental growth and property appeal. |
| Vacancy Rate | Key indicator of income stability and portfolio quality. High vacancies often signal weaker assets. |
| Geographic and Tenant Diversification | Helps assess concentration risk. FIIs with exposure to São Paulo may trade at a premium, while diversified portfolios reduce location dependency. |
| Price-to-Book Ratio | Useful valuation reference point, but not conclusive on its own. Must be paired with income analysis. |
| Trading Volume / Liquidity | Reflects investor confidence and how easily shares can be bought or sold. Also indicative of fund longevity. |
| Accumulated Result | Undistributed earnings can enhance short-term distributions, but they don’t contribute significantly to long-term intrinsic value. |
Gross Dividend Yield
Gross yield is easy to find and typically calculated using either the last 12 months of dividends or the most recent payout. For example, the XPML11 chart from Funds Explorer shows a yield of 10.42% over the past 12 months, or 0.89% for the latest month, which annualizes to 10.68%.
The 12-month view helps smooth out short-term fluctuations, especially since FIIs are only required to distribute 95% of their income every six months. As a result, a full-year average often provides a better sense of overall return and also accounts for seasonality.
That said, the most recent monthly yield may give a more up-to-date picture of the fund’s current income potential, especially if recent rental contracts or tenant shifts have changed the outlook.
Adjusted Dividend Yield
Not all dividend payments come from recurring income. For example, when an FII sells a property like a shopping mall, it might distribute the capital gain to investors over multiple months. While often marketed as asset recycling, these payouts inflate the headline yield, making it unsustainable and potentially misleading.
Take HGBS11 as an example. In 2024, it received R$1.45/unit from real estate income and its true operational income was only R$1.35/unit after expenses.
At the same time, it also received R$4.74/unit from non-recurring gains — profits from previously contracted asset sales.

Despite this, HGBS11 paid an average of R$1.69/month in dividends throughout 2024, significantly higher than what it earned from recurring operations. Management has stated they plan to maintain this level (around R$1.60/month) through the first half of 2025, which has held true so far.
But to maintain this distribution during the second half of 2025, the fund must sell more assets. This introduces risk and signals a model that may not be sustainable, especially if asset sales become harder in a weaker market.
Comparable Analysis Example – Shopping FIIs
The table below uses 2024 year-end data with prices as of May 30, 2025.
- Adjusted dividend yield reflects recurring income only; gross yield includes all 2024 distributions
- SSS Growth = Same Store Sales growth from 2023 to 2024 (measures sales performance on stabilized properties)
- Vacancy is as of December 2024 (seasonality matters)
| FII | 2024 Div Yield | Adj. Div Yield | SSS Growth | P/B | Market Cap | Vacancy |
| HGBS11 | 10.0% | 8.1% | 4.9% | 0.93 | R$2.6B | 4.7% |
| HSML11 | 11.1% | 8.4% | 7.0% | 0.78 | R$1.8B | 3.7% |
| MALL11 | 9.8% | 9.6% | 7.0%* | 0.83 | R$1.4B | 4.0% |
| VISC11 | 10.4% | 8.7% | 5.5%* | 0.83 | R$3.0B | 5.4% |
| XPML11 | 10.6% | 10.2% | 2.8% | 0.89 | R$6.1B | 3.4% |
| Average | 10.5% | 9.0% | 5.4% | 0.85 | R$3.0B | 4.2% |
*Estimated based on available monthly data.

This data shows that quality shopping FIIs often trade at similar valuations, suggesting a relatively efficient market. Valuation differences typically reflect qualitative factors. If a fund offers a much higher yield or lower price-to-book ratio than peers, there’s usually a reason and it may be too good to be true.
Diversifying across large, high-quality FIIs with strong liquidity is a solid approach for most investors. That said, headline yields can include non-recurring gains, so part of your dividends may need to be reinvested to preserve purchasing power over time.
MALL11 stands out with a high adjusted dividend yield and strong SSS growth (7.0%), supported by solid sales per square meter. However, its smaller size and lower exposure to São Paulo (only 19% vs. 86% for HGBS11) may warrant a valuation discount.
XPML11 offers a consistent recurring dividend and is the largest fund in its peer group. However, its SSS growth was weaker during 2024, despite strong historical performance. XPML11’s recent property acquisition at a 7.5% implied discount rate may also dilute shareholder returns and increase short-term liabilities.
This kind of relative analysis helps highlight over or undervaluation that headline yields alone might obscure.
But deeper research is essential to truly evaluate a fund. Before investing, make sure your Comparable Analysis considers asset quality, recent transactions, and the sustainability of income.
Price-to-Book-Value: A Cautious Take
I consider price-to-book (P/B) value, but only give it limited weight , and only when it’s based on a reputable appraiser’s fair market value assessment.
Why I’m Cautious with P/B Values:
High-quality FIIs like XPML11 are audited annually, including full property revaluations. For example, XPML11’s latest valuation (as of June 30, 2024) was prepared by top-tier firms like Colliers and Cushman & Wakefield.
But in my experience, these are more art than science.
Even with adjustments for interest rates and comps, appraised book values often:
- Are 6–12 months out of date
- Lag market sentiment and price discovery
- Are based on subjective estimates and external comparables
- Vary by fund and appraiser
- Fall within an error margin that makes comparisons murky
- Use different appraisal dates (e.g. XPML11 in June, HGBS11 in December)
How I Use It:
I’m reassured when high-quality funds trade at a discount, but I don’t assume XPML11 is “more expensive” than VISC11 just because one trades at 0.89x book and the other at 0.83x. That’s well within the margin of error for most appraisals.
I tend to trust the market, especially for large, liquid FIIs, more than appraisals built on spreadsheets and theory.
Case Study: HCTR11 & Office FIIs
Take HCTR11 for example, where the P/B is just 0.22x. That number sounds compelling, but it’s nearly meaningless given the nature and condition of the fund’s assets. I’m also skeptical of office FIIs in general, as their book values often fail to reflect real-world impairments or leasing challenges.
For me, P/B is only helpful when it’s paired with recent sales, high-quality data, and real market validation.
Vacancy, Tenancy Risk & Location
Vacancy and tenant concentration are two of the most important real estate risk factors and often easy to overlook when chasing high yields. Properties in prime locations, such as São Paulo, may also command valuation premiums.
FIIs with low vacancy rates and strong tenant quality offer objective signals of high asset quality, location desirability, and operational strength.
BTLG11 is a standout example: its portfolio of logistics assets has a weighted vacancy rate of just 1.4%, with dozens of tenants and full occupancy in most properties.

Source: BTLG11 April 2025 Management Report/Presentation
One drawback of low vacancy rates is asymmetric risk: with little room to add tenants, rental growth depends heavily on renewals with existing occupants.
That said, low vacancy remains a strong indicator that a fund like BTLG11 is well-managed, with effective capital allocation and desirable properties.
Another important consideration is tenancy risk.
For example, BTLG Cajamar I spans 57,153 square meters in São Paulo State (about 43 km from the city center) and is leased to a single tenant. Logistics and urban FIIs (e.g. groceries) often have just one or a few large tenants with long-term leases.
Fortunately, Cajamar I is leased to Amazon, a blue-chip tenant with minimal credit risk. Its presence adds confidence to the asset’s quality and location. By contrast, BTLG Cajamar II is leased to Assaí, which I consider a bit riskier than Amazon. That said, the overall quality of BTLG11’s tenants appears strong.
In short, low vacancy and blue-chip tenants are marks of a well-managed, high-quality FII, as long as investors stay mindful of tenant concentration and sector-specific risks.
Another layer of tenant risk is the portfolio’s exposure to lease expiration schedules and contract types. Itaú provides a helpful snapshot of BTLG11’s tenant breakdown:

Source: Itaú May 2025 FII Report
- 51% of leases are set to expire in the short to medium term, while 49% extend into 2029 or beyond, a timeframe Itaú views as a healthy maturity profile
- Despite large tenants like Assaí and Amazon occupying full warehouses, BTLG11 appears well-diversified across tenants
- About 65% of leases are ‘typical’, covering expenses like taxes, insurance, and maintenance, reducing operational risk
- The remaining 35% are ‘atypical’, likely custom agreements tailored to tenant-specific needs
Atypical contracts may be harder to re-lease to new tenants at the same price point, but they also suggest tenant commitment and lease stickiness.
Despite large tenants like Assaí and Amazon occupying full warehouses, BTLG11 appears well-diversified across tenants.
BTLG11’s asset strategy is focused and coherent: the fund concentrates on quality logistics properties located near São Paulo. This supports both operational efficiency and manager specialization. Thematic strategies like this can offer scale and expertise advantages, similar to well-positioned FIIs that own high-traffic shopping malls or premium residential rental units in major city centers.

Source: BTLG11 April 2025 Management Report/Presentation
Sector Exposure
Sector exposure is partly a matter of personal preference, but diversifying across FII categories generally makes sense, especially when certain sectors become overbought or more vulnerable to shocks. Each segment responds differently to macroeconomic cycles, regulation, and investor risk appetite.
Unfortunately, the Brazilian FII market remains relatively narrow. It’s underexposed to residential rental segments (like apartments) and lacks entire themes common in North America such as data centers, student housing, and long-term care REITs.
Shopping Malls
- Several large and liquid FIIs with experienced managers
- Often located in prime urban or downtown areas
- Tenant mix is diversified and adaptable (e.g. fashion trends shift, but stores evolve)
- Sales per square meter and SSS continue to grow, signalling pricing power and rent upside
- Many top-tier assets still offer attractive yields
- In Brazil and across LATAM, malls are an experience, combining air conditioning, cinemas, concerts, and upper-middle-class dining (e.g. Outback)
Logistics
- Several large and liquid FIIs with well-regarded managers
- Typically located in logistics hubs such as São Paulo’s metro area and Extrema, Minas Gerais
- Leased to large, high-quality tenants (e.g. Amazon, Whirlpool)
- Properties are likely attractive to multiple tenants due to strategic locations
- Some single-tenant exposure exists (e.g. BRCO11 and Natureza), which may increase leasing risk
- Regulatory dependencies (e.g. Extrema’s tax incentives) exist but are unlikely to disrupt long-term e-commerce trends
- Attractive yields driven by stable, recurring income
Office FIIs
- Several large and liquid FIIs with well-regarded managers
- Tier A office space in São Paulo (e.g. Faria Lima) appears relatively resilient, as illustrated by Itaú’s recent R$1.5B headquarters acquisition
- Still, I remain cautious due to structural risks like remote work and changing space demand
- Property quality is harder to assess and likely requires deeper due diligence
- Vacancy rates can be high. For example, PVBI11 reported a 13.4% vacancy rate in its latest disclosure.
- Dividends tend to be inconsistent or lack growth visibility
- Yields are low compared to Shopping and Logistics FIIs
- According to PVBI11’s April report, the average price-to-book value of Office FIIs in the IFIX was 0.68x compared to 0.84x for Shopping FIIs and 0.91x for Logistics FIIs
- I’m skeptical of book values, and market pricing seems to support that view
- Globally, office real estate is under pressure. For example, the Canadian Pension Plan sold two Vancouver towers at a loss and a Manhattan redevelopment project for $1 due to debt exceeding equity value
Urban FIIs
- Several large and liquid FIIs with well-regarded managers
- Funds like HGRU11 often target built-to-suit urban assets with long leases to grocers or schools, but tenant concentration and location specificity can raise re-leasing risk if defaults occur
- Grocery tenants like Assaí (ASAI3) and Atacadão (CRFB3) are low-margin and often occupy entire custom buildings, which can dominate a fund’s portfolio
- Many properties are location-specific (e.g. on highways rather than downtown), which limits reuse and may reduce appeal to new tenants
- Tenant replacement risk is high. It’s hard to predict who could take over from a failed anchor like Americanas or Casas Bahia
- Yields are modest relative to risk profile
- Educational tenants may face disruption from online learning or regulatory changes (e.g. restrictions on teaching certain procedures like botox)
- This segment requires deeper research to understand site-level risks and tenant stickiness
Apartments & Other FIIs
- Few large, liquid options exist in this category
- I generally haven’t found any funds I like outside the Shopping and Logistics sectors, though I admit this may reflect my own pickiness
- I avoid hybrid funds, as I prefer a clear investment thesis and visibility into both current and future assets
- I find agriculture thematically interesting, but I classify it under my portfolio’s commodity allocation. Most B3 investors are already indirectly exposed to agriculture via equities, and stocks like AGRO3 offer a direct route
- Sectors like hospitals or hotels could be compelling, but the current FII offerings are limited and lack scale
Asset Participation
It’s important to note that many FIIs, particularly in the shopping segment, only hold a fractional ownership stake in their assets. These partial holdings are typically structured via a condominium arrangement, where the fund pays a proportional share of maintenance and receives a share of the revenue, but has limited operational control.
XPML11 is a clear example. While it holds a stake in 29 developments across Brazil, the fund often owns less than 50% of the asset, and in some cases, far less.
Partial ownership can enable AUM-driven growth. For example, buying a 10% stake in a mall just to increase fund size and collect management fees, even if the stake is operationally insignificant.
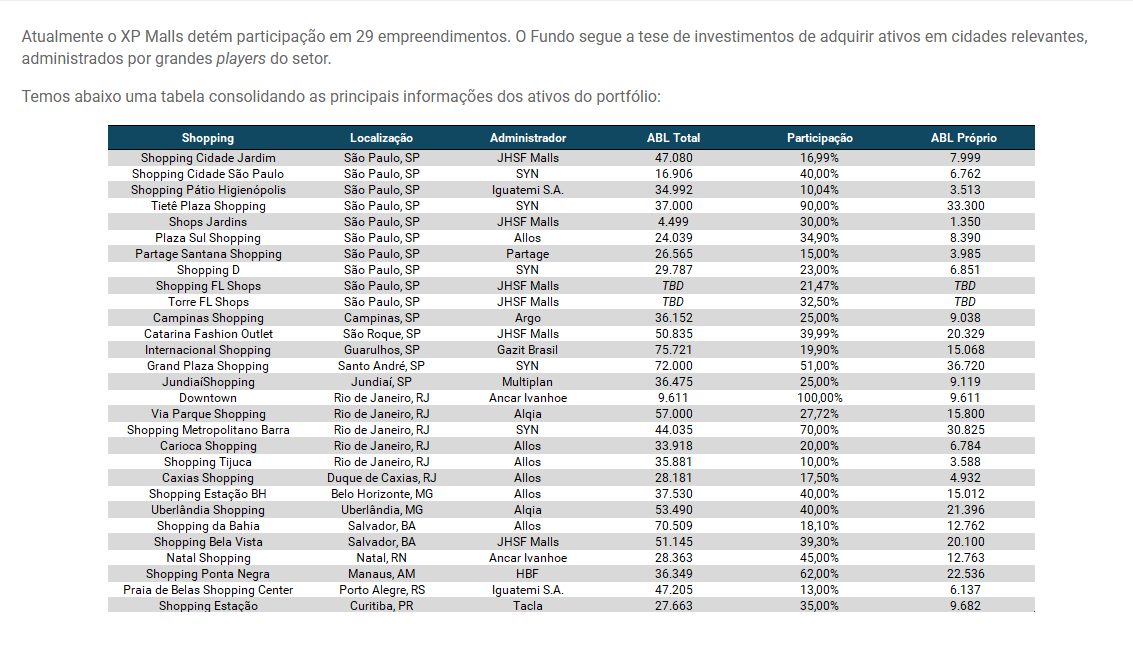
Source: XPML11 Website
Investors should also evaluate how much ABL (Área Bruta Locável) a fund actually owns, not just total mall size. A 70,000m² mall sounds impressive but if the fund owns only 10%, the economic exposure is much smaller.
Fund Size, Liquidity & Manager
- I don’t use hard rules, but generally prefer funds with R$1B+ in market capitalization and multiple underlying assets
- I look for reputable managers with a track record and other funds under management, ideally affiliated with well-known financial institutions
- For example, BTLG11 is managed by BTG Pactual, which I consider more reliable than a R$40M fund run by an unknown manager
- BTG Pactual reports R$2T in assets under management and a strong brand, which likely discourages reckless behavior
- Larger managers may benefit from scale economies, even if fees are a flat % of AUM
- I prefer funds that publish regular, detailed reports. I only use screening tools like Funds Explorer for quick overviews
- The fund should be audited by a reputable, independent auditor
- I don’t prioritize administration fees in my first filter but fee structure can matter. For example, a 20% performance fee might drive better alignment than a flat fee, though it may also incentivize riskier behavior if rates fall below benchmark thresholds
- While daily trading volume matters in theory, it can usually be ignored by retail investors who stick to well-known funds with stable liquidity
Other Pitfalls I Avoid
- I avoid new funds with no track record. Without past reports, management history, or tenant stability, it’s hard to judge execution
- I’m cautious of funds that have recently raised significant capital but haven’t yet deployed it. If they delay purchases, they risk losing purchasing power to inflation. Worse, they may feel pressured to buy subpar assets just to “put money to work”
- I don’t like paying a manager who made a single 10% investment in one property and calls it a fund. I don’t think that structure is sustainable, and I find it hard to justify the management fees for what is effectively a small minority position in someone else’s asset
Additional Qualitative Research
- Where possible, I read reports like those provided by Itaú as they offer good overview summaries and better context for the funds I invest in
- Funds recommended by a reputable bank like Itaú won’t necessarily outperform the market, but this likely serves as a good screening mechanism to prevent ‘bad’ investments
Historical Performance vs. CDI
The Google chart of the IFIX below dates back to September, 2012, and includes dividends.
At inception on December 30, 2010, the base value of the IFIX was 1,000, resulting in a nominal CAGR of ~8.8% based on today’s price of R$3,440.31. The same R$1,000 corrected by the CDI would be R$3,667.09, implying a CAGR of ~9.3%.
The IFIX tended to outperform the CDI during falling interest rate periods and underperform when interest rates rose.
Adjusted for IPCA, the real return of the IFIX since inception had a CAGR of only 2.9%.

Many commentators on social media argue that the best strategy is to simply invest in CDI, relax, and ignore FIIs or equities altogether. If real interest rates continue to rise, I think this is correct.
During September, 2012, the SELIC basic interest rate (similar to CDI) was 7.50%. The IFIX finds local bottoms around February, 2014 and January, 2016, which is likely related to the large Operation Car Wash (Lava Jato) corruption scandel and the corresponding SELIC rate peaking at 14.25% from July, 2015 to August, 2016.
From a low of about 1,322.96 in January 2016 to a high of about 3,253.76 in January 2020, the IFIX returned a CAGR of ~25.3%. This corresponded with interest rates bottoming at 2% between May, 2020 and March, 2021, before rising rapidly during COVID. I’ve calculated an even higher CAGR of >32% for the IBOVESPA based on the same cherry-picked period.
To further illustrate my point, I’ve pasted a chart of XPML11 below.

During our dividend review, we saw that XPML’s distributions grew with an 11% CAGR betwen 2019 and 2024, but the share price is flat or down. I think there’s a simple explanation: R$6.48 of dividends on May 24, 2019 was worth R$106.62 because investors only expected a 6.1% yield at the time (Selic was 6.50%) and today Selic is 14.65%. Factoring in investor long-term interest rate expectations today, R$11.04 of dividends are worth sightly less than R$6.48 of dividends 6 years ago. But there’s nothing fundamentally wrong with XPML11’s performance over the past 6 years (it was actually quite good, even with COVID). With steady or even declining interest rates, I’m confident total returns would have significantly outperformed CDI.
Future Outlook & Risks
I think it’s a mistake to assume rising real interest rates will allow the CDI to outperform FIIs and the IBOVESPA over the long-run.
A crash abroad, particularly in US markets, would likely lower global interest rates. Alternatively, a more benign scenario could improve commodity prices and the Brazilian fiscal situation.
Even if Brazil’s fiscal situation worsens, the government likely won’t be able to sustain high single-digit real interest rates beyond the next few years.
I think the biggest risks result from potential future taxation and under-reported inflation.
- On October 31, 2006, the Canadian government announced a surprise increase in how Income Trusts were taxed, raising the rate to over 30%. This resulted in a 12% market drop the next day and was infamously dubbed the “Halloween Massacre”
- A similar risk for Brazilian FIIs is not unforseeable and I speculate could result in an effective 15% loss in income and dividend yield
- Governments often under-report inflation measures like IPCA to help inflate away their real debt obligations. This is commonly referred to as financial repression and could mean that lease adjustments don’t keep pace with real inflation. But in the long-run financial repression would impact fixed income investors the most and could actually benefit real estate investors
Although I don’t invest directly in the CDI myself, I also think investing in both the CDI and FIIs could be a prudent counterbalancing strategy to reduce return volatility.
Tools & Research I Use
- Funds Explorer is an excellent tool for initial screening with 652 registered FIIs and great for looking at things like dividend history
- The IFIX composition lists the 117 names that comprise the index as well as their weightings. This gives a good starting point to find important funds. I generally avoid funds that aren’t in the IFIX and prefer those with higher weightings to stay closer to index quality and liquidity
- Itaú provides research on a small number of names that I find very useful. You can find their latest May report here
- For reports after May 2025, you can navigate the Itau recommendations site here, to try and find newer reports
- I always go to the Investment Manager’s website and read reports and review the investment portfolio before investing. You can try searching Google using something like ‘BTLG11 ri’. In this particular case, they even have an English option!
Next Steps
Choosing the right Brazilian FIIs can feel overwhelming at first, but a simple, structured approach makes all the difference. I personally prioritize consistent income, strong management, and long-term fundamentals. For most investors, sticking with well-known funds that hold a significant weight in the IFIX (or even investing in the index itself) is often the most prudent starting point.
If you’re new to FIIs, begin by selecting a few promising tickers and tracking them over the next few months. Read the monthly reports, observe how they respond to market conditions, and get a feel for their management quality and income consistency.
I’ll be sharing deeper dives on individual FIIs soon. Follow me on Twitter to stay in the loop.
Please also feel free to share or leave a comment below!
FII Deep Dives
Disclosure
I currently hold long positions in several of the FIIs mentioned in this article, including BTLG11, BRCO11, HSML11 and XPML11. I am also long other investments that are mentioned, namely, IFRA11, JURO11 and AGRO3. I may also initiate or increase positions in other FIIs discussed here in the future. This content is for informational purposes only and does not constitute financial advice. Always do your own research and consult a licensed advisor before making investment decisions.
IMPORTANT LEGAL DISCLAIMER
The information provided on this website is for general informational purposes only. All content is based on personal opinions, experience, or publicly available data, and is not intended as financial, legal, tax, or investment advice. Nothing here should be construed as a recommendation to buy, sell, or hold any financial instruments.
I am not a certified financial advisor, and I do not know your personal financial situation. Always consult with a qualified professional before making any investment decisions. Gringo Investor and its creator disclaim all liability for any loss or damage incurred as a result of reliance on this information.
Investing involves risks, including the potential loss of principal. Past performance is not indicative of future results.
This site is operated for an international audience and is not intended to comply with CVM regulations or provide formal investment recommendations in Brazil.