Table of Contents
- Fund & Portfolio Overview
- Dividend History & Sustainability
- Future Outlook & Operational KPIs
- Final Verdict
- Disclosure & Legal Disclaimer
XPML11 is one of Brazil’s largest and most liquid FIIs, offering exposure to a diversified portfolio of high-performing shopping centers. But with recent changes in interest rates, new acquisitions, and evolving sector dynamics, many investors are asking: is XP Malls still a top-tier fund?
This article evaluates the quality of XPML11’s assets, recent earnings performance, dividend consistency, and risk profile to help you decide if it still deserves a place in your portfolio.
Fund & Portfolio Overview
XPML11 is the largest and most liquid shopping mall FII in Brazil, with a market capitalization of R$5.9 billion and a 4.19% weighting in the IFIX. That makes it the third-largest component of the index and the largest among all brick-and-mortar FIIs. The fund is operated by XP Asset Management.
XP Malls has a large, diversified portfolio, with participation in 29 different premium shopping malls, representing ownership of ~330,000 square meters of Área Bruta Locável (“ABL”). It often holds minority stakes (typically less than 50%).
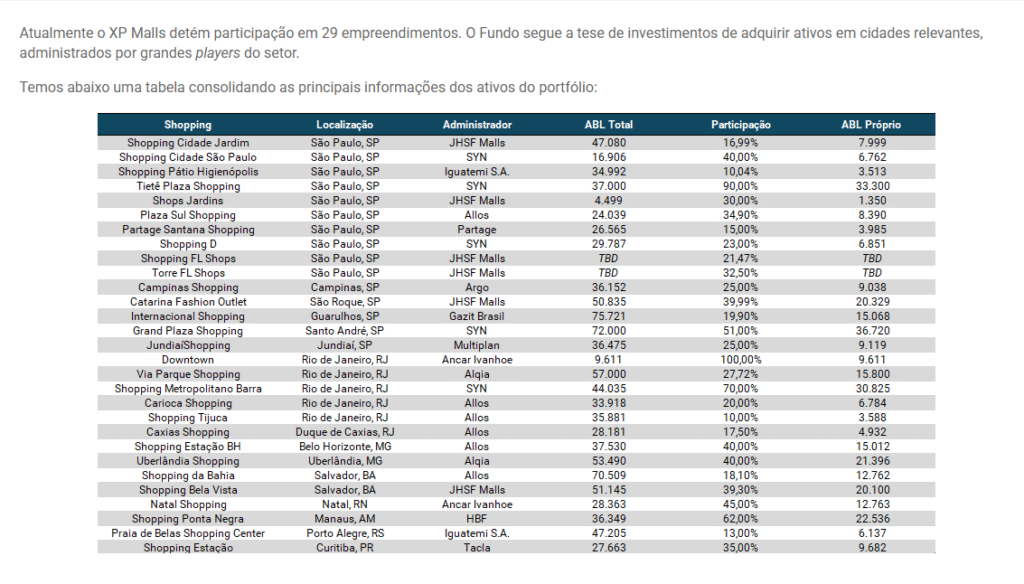
Source: Fund website. June 7, 2025.
Approximately half of XPML11’s ownership by square meter is concentrated in the state of São Paulo. The remainder is diversified across seven other states, with exposure to the Northeast, South, and North regions of Brazil. On the management side, the portfolio is also well distributed, though over 30% of ABL is managed by SYN.
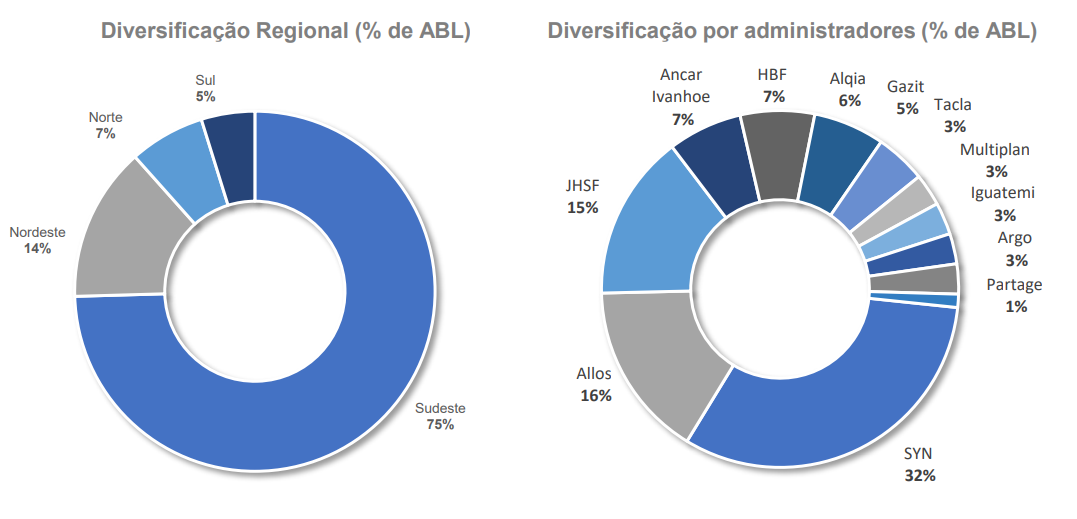
Source: XPML11 April 2025 Management Report
This high regional concentration in the Southeast reflects XPML11’s strategy of focusing on economically stronger regions with higher retail density. While SYN remains the leading administrator in terms of ABL share, the fund’s partnerships with other major players like Allos, JHSF, and Iguatemi provide diversification in operating styles and negotiation leverage.
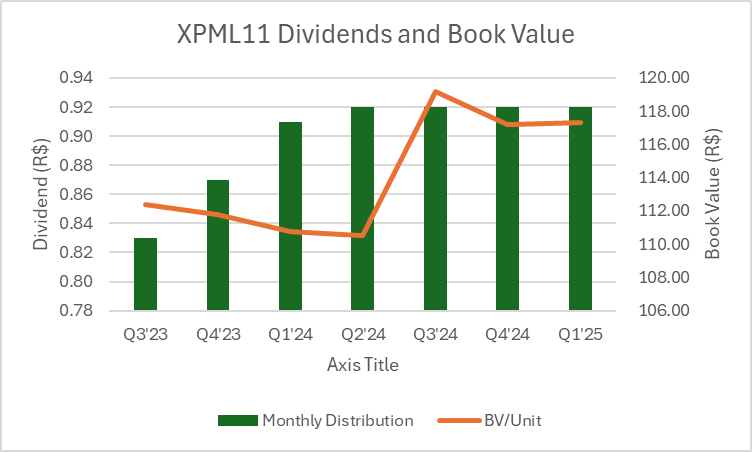
XPML11 has expanded rapidly since Q1’23, doubling its ABL and increasing its unit count by 84%. Between December 2023 and March 2025, the fund’s book value rose by 93%, supported by a series of acquisitions, including the high-profile SYN portfolio.
Importantly, this growth occurred without diluting owners on a book value per unit basis. The fund even recorded a positive revaluation during Q3’24.
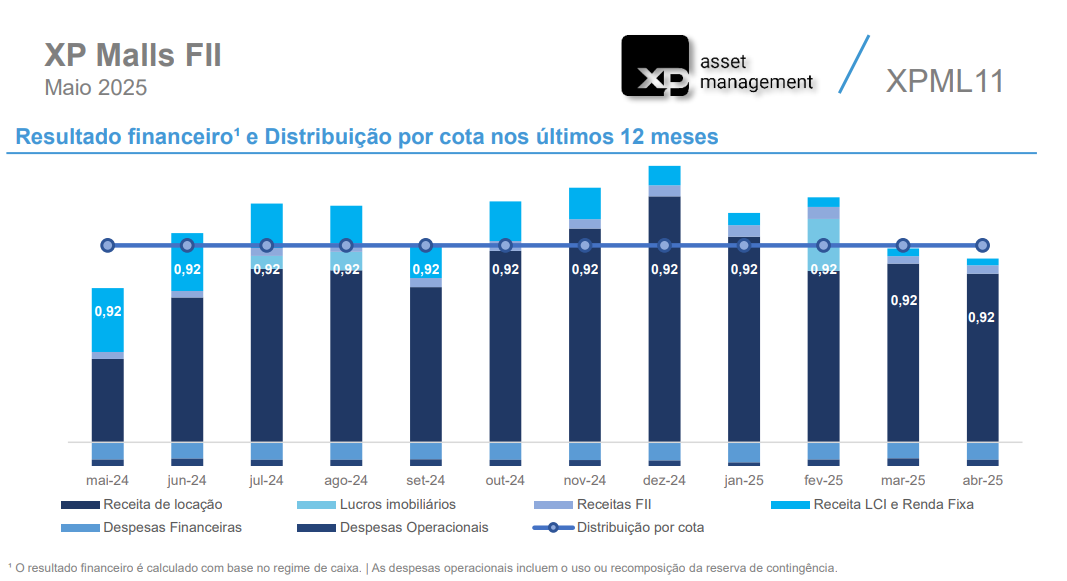
Monthly dividends have remained stable, growing from R$0.83 to R$0.92 per share over the past seven quarters. This consistency, despite significant portfolio expansion, suggests strong underlying cash flow and prudent management.
| Q2’24 | Q3’24 | Q4’24 | Q1’25 | |
| Malls | 23 | 23 | 24 | 26 |
| Units (M) | 55.3 | 55.3 | 55.3 | 56.7 |
| BV | R$111 | R$120 | R$117 | R$117 |
| Div | R$0.92 | R$0.92 | R$0.92 | R$0.92 |
| Vac % | 4.7% | 4.4% | 3.7% | 4.5% |
Source: Company spreadsheet and documents, Gringo Investor calculations
The fund charges an administration fee of 0.75% on AUM (above R$1 billion), plus 20% of profits exceeding IPCA + 6%. While this structure limits some upside for investors, it also aligns incentives, especially important for a fast-growing fund with the ability to raise AUM through dilutive offerings.
Beyond the manager, XPML11 is supported by a dedicated team of 4 analysts, 4 engineers, and a controller. This level of staffing reflects economies of scale rarely seen in smaller FIIs.
In the sections that follow, I’ll break down XPML11’s portfolio composition, income quality, tenant risks, and long-term outlook. You can also read my detailed methodology for choosing the best FIIs here.
Dividend History & Sustainability: Is XPML11’s Yield Built to Last?
XPML11 has a strong track record of growing dividends, with the exception of the COVID era, which had a significant negative impact on shopping mall performance.
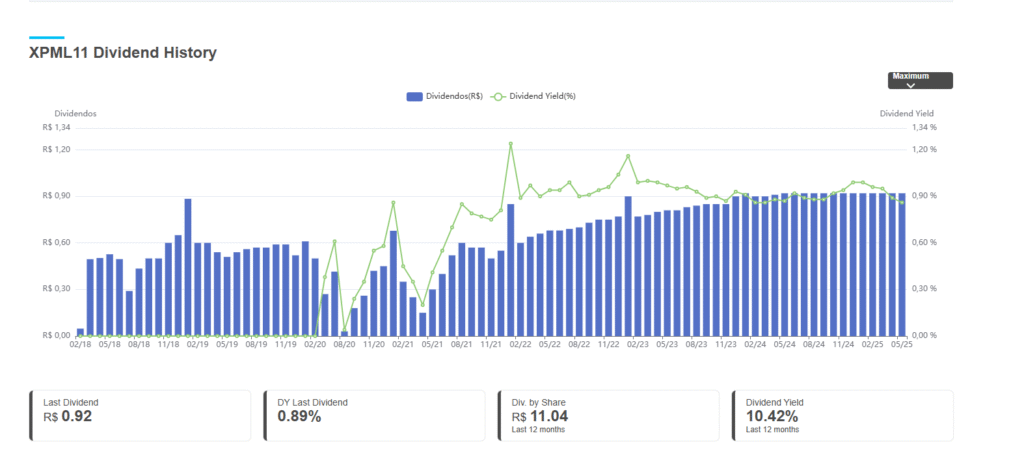
Source: Funds Explorer
Based on a current unit price of R$103.29, XPML11’s headline dividend yield is 10.7%. The fund distributes R$0.92 per month, totaling R$11.04 over the past 12 months. Adjusting for R$27M in real estate profit and assuming a 100% distribution rate, I estimate that R$10.96 was sustainably generated, equivalent to a yield of 10.6%.
The fund’s portfolio is also concentrated in class ‘A’ and ‘B’ assets, which tend to be more resilient during economic downturns.
However, dividend analysis is complicated by the fund’s recent acquisitions and unit issuances. A meaningful portion of income during the year came from fixed income, which likely offered higher returns than the same capital will generate once fully deployed into brick-and-mortar assets. Seasonality also plays a significant role in retail performance, making year-over-year comparisons difficult, especially given how different the current portfolio is from a year ago.
Source: XPML11 April 2025 Management Report
Nonetheless, XPML11 closed April 2025 with R$0.99 per unit in undistributed earnings, providing a buffer to sustain or even increase dividends in the short term. Earnings typically strengthen in the second half of the year, so it’s possible the fund will modestly raise its payout over the coming months.
However, investors should be aware that XPML11 expects a R$285 million cash shortfall by year-end, due to acquisition-related obligations, particularly from the SYN portfolio. That projected gap could grow to R$583 million by 2027, not including property transfer taxes (ITBI) or potential earn-out clauses.
Even so, the fund’s balance sheet appears strong. With R$7.8 billion in real estate assets and R$6.6 billion in net equity, the projected obligations represent less than 10% of book value and about 10% of market cap. Significant, but not alarming at this stage.
XPML11 has three potential paths to meet these obligations: (1) asset sales, (2) issuing new equity, or (3) taking on additional debt. While asset sales or borrowing could reduce future cash flow, issuing equity risks diluting existing shareholders. Fortunately, the fund owns a high-quality portfolio, its units are highly liquid, and current leverage is low (25.9%), making all three options viable if needed.
However, BTG Pactual has estimated that XPML11’s recent acquisition from ALOS3 came with an exit cap rate of just 7.5%. Without earnings growth, such transactions could pressure long-term distribution sustainability and raise questions among shareholders. It will be important to monitor the manager’s discipline in future deals. The fund’s model of acquiring minority stakes makes these transactions easier, although the 20% performance fee helps align incentives, partially offsetting the incentive to grow the 0.75% AUM fee.
Still, recent acquisitions appear to be premium-quality assets, potentially offering strong upside:
- Tijuca’s NOI is >R$3,500/m², well above the national average
- Shopping Pátio Higienópolis is a “trophy asset,” with excellent demographics and low competition
XPML11’s 10.6% sustainable yield compares favorably to my estimated peer average of ~8.7% (HGBS11, HSML11, MALL11, and VISC11). The fund’s book value trades at a slight premium (~0.89x vs. ~0.84x) and Itaú considers the portfolio the best among its peers.
Even assuming XPML11 issues 10% more equity to fund its obligations, the sustainable dividend should still remain comfortably above the average of its peers.
Future Outlook & Operational KPIs
Same Store Sales (SSS) increased by 12.4% in April 2025 compared to the prior year. However, this jump was influenced by calendar effects: Easter fell in March in 2024 and in April in 2025, inflating year-over-year comparisons.
Since Q1’23, average quarterly SSS growth has been 6.4%, roughly in line with peers. Growth last quarter was just 2.4%, largely due to seasonality.
Same Store Rent (SSR) has averaged 4.4% over the same period (Q1’23 – Q1’25), suggesting that rental income has broadly kept pace with inflation.
However, portfolio-level metrics like sales per square meter and NOI/m² are difficult to interpret due to the number of recent acquisitions. Since we’re not comparing the same set of malls across periods, gross averages can be misleading.
In a rough analysis, I found that malls held continuously from Q4’23 to Q4’24 increased sales/m² by 8.5%. NOI grew even faster, but extreme outliers make this data noisy and hard to interpret.
Vacancy stood at 3.9% in April 2025 and has declined from 4.6% a year earlier. Vacancy has remained stable, and XPML11’s rates are consistent with peer averages. With over 4,700 tenant spaces, the fund has low exposure to any single lessee.
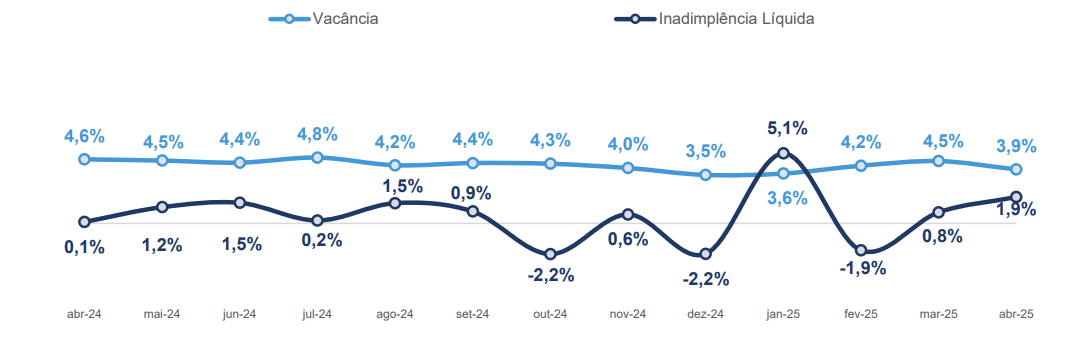
Source: XPML11 April 2025 Management Report
These metrics reinforce XPML11’s operational resilience, but investors should remain attentive to the risks tied to aggressive growth at modest cap rates.
Final Verdict
XPML11 is Brazil’s largest and most liquid shopping FII, offering a high-quality and diversified portfolio. It currently delivers a dividend yield above peer averages, and its long-term outlook remains strong, assuming management maintains discipline in future acquisitions.
In the short term, however, the fund may face challenges in growing its dividend alongside inflation, given its recent acquisition activity and pending obligations. Still, the elevated yield provides investors with a margin of safety, offering a cushion against modest distribution cuts or potential dilution.
If you’re comparing mall FIIs, I’ve also published a detailed review of HGBS11 in 2025, including its dividend sustainability and recent transactions.
Disclosure
I currently hold a long position in XPML11 and may increase my allocation in the future. This content is for informational purposes only and does not constitute financial advice. Always do your own research and consult a licensed advisor before making investment decisions.
IMPORTANT LEGAL DISCLAIMER
The information provided on this website is for general informational purposes only. All content is based on personal opinions, experience, or publicly available data, and is not intended as financial, legal, tax, or investment advice. Nothing here should be construed as a recommendation to buy, sell, or hold any financial instruments.
I am not a certified financial advisor, and I do not know your personal financial situation. Always consult with a qualified professional before making any investment decisions. Gringo Investor and its creator disclaim all liability for any loss or damage incurred as a result of reliance on this information.
Investing involves risks, including the potential loss of principal. Past performance is not indicative of future results.
This site is operated for an international audience and is not intended to comply with CVM regulations or provide formal investment recommendations in Brazil.