Launched in 2019, TRXF11 is Brazil’s second-largest urban real estate fund (FII), ranking behind HGRU11 in market capitalization and ahead of RBVA11. Managed by TRX, TRXF11 focuses on essential retail assets and has a market capitalization of approximately R$2.1 billion. The fund represents 2.17% of the IFIX index and carries a weight of 5.04% in the HERT11 ETF.
TRXF11 holds a larger weighting in the IFIX than HGRU11 (2.17% vs. 2.09%) despite its materially smaller market capitalization (R$2.1B vs. R$2.9B). The fund also receives notable coverage from banks, brokers, and independent analysts.
Note that this page was last updated June 26, 2025.
TRXF11 Key Facts
| Metric | Value |
| Fund Name | TRX Real Estate FII |
| Manager | TRX |
| Management Fee | 1.00% of AUM plus 20% performance fee on returns above the IPCA + 6% benchmark |
| Manager Website | https://www.trxf11.com.br/ |
| Inception | 15/10/2019 |
| Sector | Urban Real Estate |
| Market Cap | R$2.1B |
| Number of Properties | 56 Urban Locations and more than R$600M of other FIIs |
| Gross Leaseable Area (ABL) | ~593,000 square meters |
| Current Price | R$102.61 |
| Price-to-Book Value | 0.99 |
| Dividend Yield (Trailing 12M) | 12.66% |
| Index/ETF Inclusion | IFIX, HERT11 |
Since inception, TRXF11 has delivered a total return of 70.71%, outperforming the IFIX (10.95%) and CDI (45.53%).
Performance Track Record
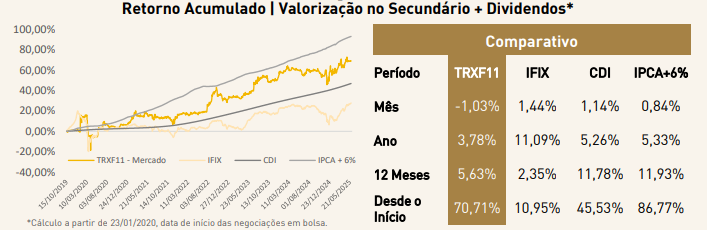
Source: May 2025 Management Report
Portfolio Overview
TRXF11’s portfolio includes 56 properties with a total of approximately 593 thousand square meters of Gross Leasable Area (ABL), positioning it as one of the key urban FIIs in Brazil. It is also worth noting that, as December 31, 2024, 34.09% of the fund’s net book value was held in other FIIs.
Tenants are typically large grocers and retailers such as Assaí, occupying ‘built-to-suit’ properties.
The fund’s properties are diversified among 13 different states.
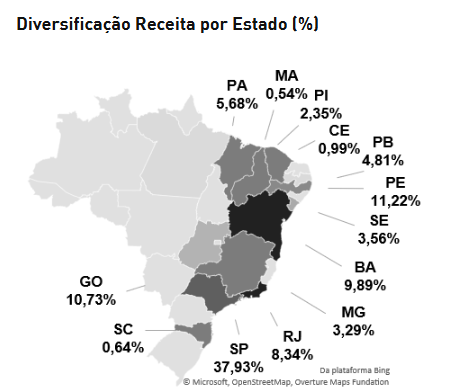
Source: TRX Website
Sector Comparison & KPIs
📈 Market Cap & Yield
TRXF11 is the second-largest urban FII, with a market capitalization of R$2.1B. It offers a 12-month dividend yield of 12.66%, roughly in line with the small group of urban FIIs included in the IFIX, but well above HGRU11’s yield of 9.65%. A large portion of TRXF11’s dividend was distributed in December and tied to a significant non-recurring gain, likely inflating the headline yield and helping explain the difference versus HGRU11.
🧮 Valuation
TRXF11 trades at a price-to-book ratio of 0.99x, in line with HGRU11 (0.99x). However, 33.68% of TRXF11’s book value is tied to special purpose entities (SPEs) — privately held companies whose valuations rely on internal discounted cash flow (DCF) models rather than third-party appraisals from firms like Cushman & Wakefield. An additional 34.09% comes from holdings in other FIIs, adding opacity and making direct peer comparisons difficult.
Although Ernst & Young reviewed these assumptions in its 2024 audit, and the values appear within a plausible range, they still limit the reliability of TRXF11’s book value in peer analysis.
As of December 31, 2024, roughly 64% of TRXF11’s FII holdings (and 22% of the entire fund) are concentrated in two other TRX-managed funds, TRXB11 and TRXB13.
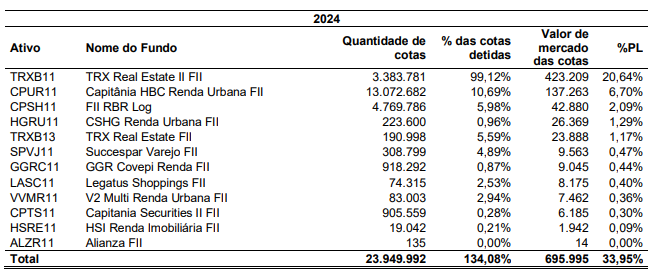
Source: TRXF11 2024 Annual Report, page 41.
While TRXB11 is controlled by TRXF11 and is expected to be merged into it, this structure still makes it difficult for external analysts to fully evaluate the underlying assets. In practice, this means investors must largely trust Ernst & Young’s review, which, while professional, cannot fully substitute for transparent, observable market data.
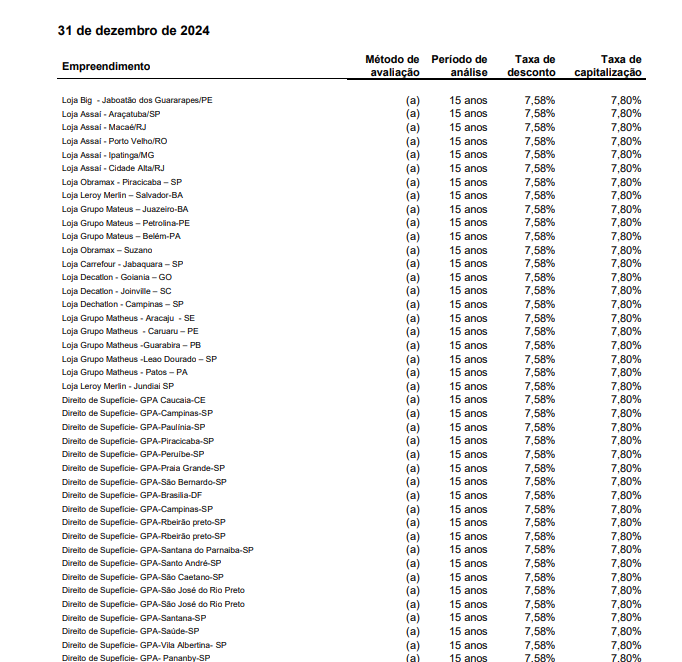
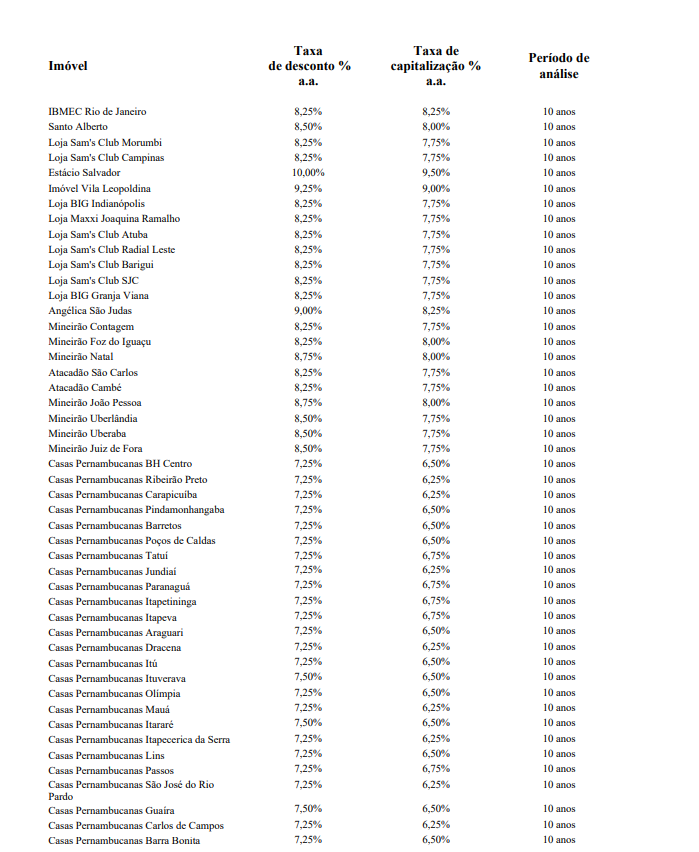
Furthermore, the fund’s appraiser applied a uniform 7.80% cap rate with a 15-year DCF horizon across all properties not held in SPEs, a relatively aggressive stance. By comparison, HGRU11’s 2024 report used individualized assumptions with a shorter 10-year forecast, reflecting differences in tenant quality, location, and property type. These methodological differences may obscure TRXF11’s true underlying asset value and reduce the reliability of its book value as a long-term return indicator.
To illustrate this point, the first of two pages from TRFX11′ 2024 audited financial statements are provided below:
The following page from HGRU11’s 2024 financials shows individualized assumptions by asset, contrasting TRXF11’s uniform 15-year, 7.80% approach.
💸 Dividend Pattern
TRXF11 has historically delivered consistent monthly dividends, often growing above inflation. However, 2024 distributions were significantly supported by one-off property sales, while recurring rental income was largely offset by CRI-related obligations. This raises questions about the sustainability of current payout levels (discussed further under the ‘Debt’ heading).
👉 Scroll sideways on mobile to view the full chart
🔐 Lease Profile
TRXF11 has a Weighted Average Lease Term (WALT) of 15.05 years, which compares favorably to HGRU11 (9.6 years). More than half the leases expire after 2040, 94% are atypical and 100% are indexed to inflation (IPCA: 98%, IPG-M: 2%), providing the portfolio with long-term security. While this provides stability, the nature of the tenant base introduces its own risks.
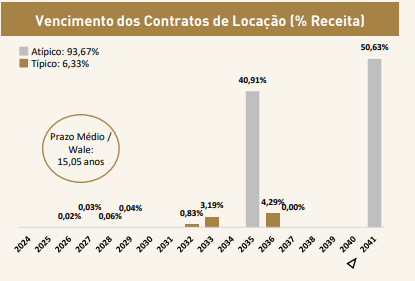
Source: TRX Real Estate FII- May Management Report
Tenants are heavily concentrated in low-margin retailers and grocers, led by Assaí (29.81%), which poses some long-term risk, particularly given the built-to-suit nature of many properties.
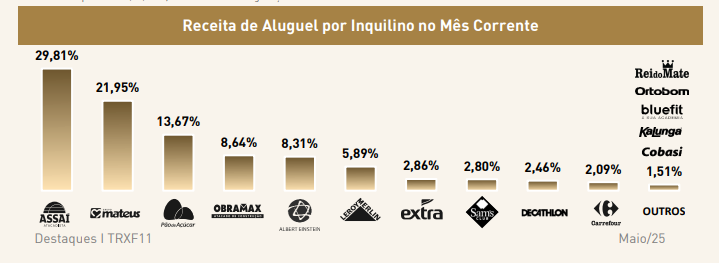
Source: TRX Real Estate FII- May Management Report
🩸Debt
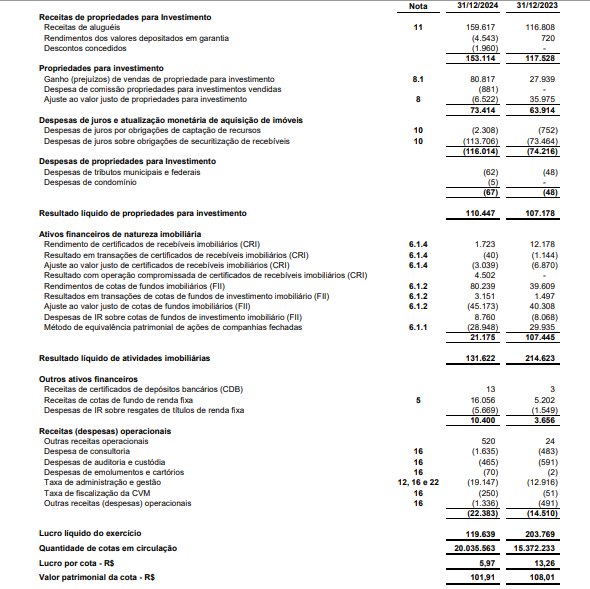
TRXF11 generated R$250M in recurring net rental income from properties, FIIs, and fixed income in 2024, but also incurred R$114M in CRI-related expenses. These material financing obligations may reduce the fund’s distributable cash flow and underscore the impact of securitization on income sustainability. As of year-end, the fund’s balance sheet reflected total CRI liabilities of R$915M.
A snippet from their 2024 income statement is provided below:
📘 Learn More
- If you’re new to Brazilian REITs (FIIs), check out my Guide for Global Investors or How I Choose FIIs
- For some great charts and graphs check out TRFX11’s page on Funds Explorer
🔗 Related Pages
Disclosure
I do not hold a position in TRXF11. This content is for informational purposes only and does not constitute financial advice. Always do your own research and consult a licensed advisor before making investment decisions.
IMPORTANT LEGAL DISCLAIMER
The information provided on this website is for general informational purposes only. All content is based on personal opinions, experience, or publicly available data, and is not intended as financial, legal, tax, or investment advice. Nothing here should be construed as a recommendation to buy, sell, or hold any financial instruments.
I am not a certified financial advisor, and I do not know your personal financial situation. Always consult with a qualified professional before making any investment decisions. Gringo Investor and its creator disclaim all liability for any loss or damage incurred as a result of reliance on this information.
Investing involves risks, including the potential loss of principal. Past performance is not indicative of future results.
This site is operated for an international audience and is not intended to comply with CVM regulations or provide formal investment recommendations in Brazil.